A recurring problem that I see is that data teams are often unaware of how critical data lineage is — not just from maintenance point of view — but from cost optimization perspective as well — to put things into the economic context.
In this post, lets discuss data lineage. What it is, why is it critical, look at some proof, and discuss what you need to make it work.
The Problem
In my work, I often see data teams at a more mature stage struggle with the same problem. The problem manifest itself as something like this:
- It takes hours for all data tables/views to be run each time.
- Business users complain about slow dashboard and outdated data.
- If you ask anyone when is “fct_orders” data refreshed in a day, nobody can give you an answer right away. You dive a bit deeper and see the table hasn’t been updated for 5 days because “something broke”.
- Once a table breaks, it takes them a day to fix at best, a few days at worst.
- Each time this happens, engineers cry, business users sigh. No one is happy. Leadership questions the costs of data being so high (hint: computational costs) while they always hear of complaints.
Does this sound familiar to you?
Diagnostics
When I hear this scenario happen, the first question I often ask is: “Can we take a look at the data lineage?”
The reaction would often be a blank look.
I used to be surprised by this, but after enough of times, this is now a default state that I expect. I have now developed the habit of searching for the lineage by myself before asking my clients. Each client would be different, however if they use dbt it would be quite fast to see (if it’s used properly that is). There are also many other options: Dataplex if they already have it enabled in GCP, Datafold, or some combination with Metaplane, etc. However, it is often the case that they either don’t have any lineage yet, or if they do, their lineage would look like this DAG jungle in dbt.
If this is the first time you have ever seen a DAG, then lets take a step back with the basic first — what is data lineage, what is DAG, what is it supposed to look like?
If you are all too familiar with DAG and lineage and instinctively held your breath looking at above scene, please skip the next section and welcome to the valley of agony.
What is data lineage?
Ok, let’s take a step back. There are a few key concepts make this conversation work.
Data lineage 101
Data lineage is simply your data origin story. When used properly, it helps you answer:
- What is the source of data behind this Customer LTV dashboard? Why is that dashboard data outdated? (full picture from data source to end point of consumption)
- If I drop this table here, what is the impact? If we think of data lineage the way we think about family tree — i.e your uncle being erased from the family tree, impact: your cousins are now non-existent. (pipeline change impact analysis)
- Should I create a new table for this new business question or should I update this existing table here to cater for that need? (balancing cost vs business needs)
- Why is this particular table running so long? (performance investigation & optimization)
At the heart of data lineage, there are a few concepts we must know:
- Nodes, each node is equivalent to a data model or data asset (dashboard, etc.). Think of it as a member of your family tree. There are a few types of nodes: data sources is where all things begin.
- Downstream vs upstream: Continuing with our family tree anecdote, you are a child of your parents, i.e a downstream object of your parents in the family tree, and your parents are referred to as upstream objects. The line that connects between upstream and downstream nodes is the lineage.
- DAG — direct acyclic graph: the visualization you see above captures all these concepts into a lineage graph, which is one-directional (hence, direct and acyclic)
What data lineage should look like
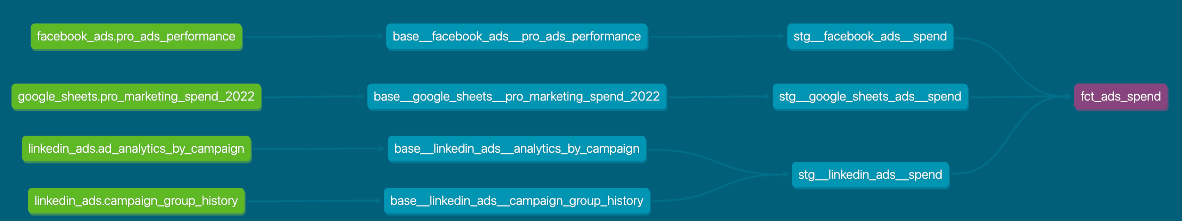
Keeping things simple without too much sideways into best practices, there are a few key words:
- ✅ acylic (straight & one directional)
- ✅ generally converged.
- ✅ there should be an ending node. You should be able to look at the full transformation DAG and understand where your T ends and where the visualization begins.
In example above, everything flow in one direction to converge at the final node fct_ads_spend . This is also the table used for dashboard directly. That is what you should expect when looking at DAG.
Valley of Agony
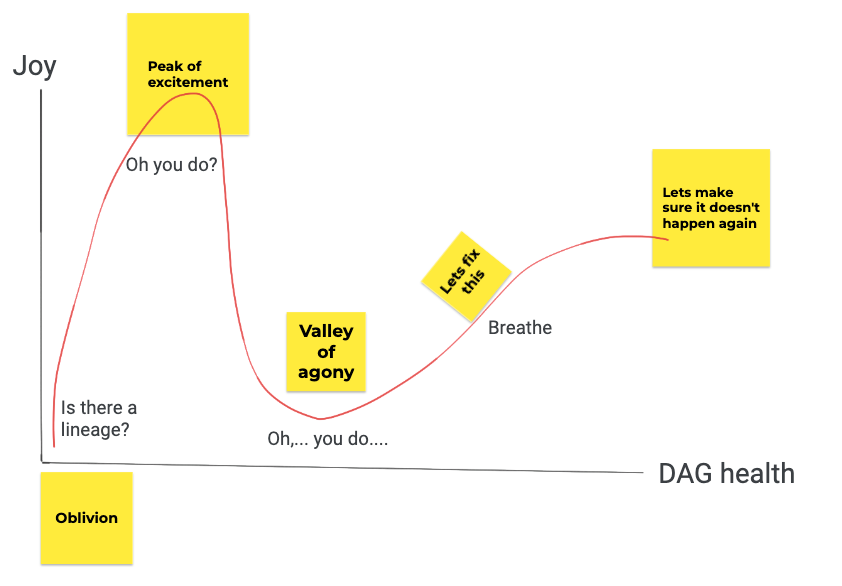
Now that you are all caught up with the basics and have a high-level understanding what data lineage should typically look like, welcome to valley of agony where we dive deeper into the jungle of spiderwebs we saw earlier.
What is wrong with that spiderweb?
When I see DAGs like that (or when there isn’t even a DAG to begin with), I know exactly why data team have the problems they have. It eventually boils down to this:
Nobody took a look at what they built
Let that sink in.
Now imagine you are doing anything blindfolded. No chance for instant feedback loop other than the sounds of angry business users.
- Exploding computation costs: To produce a single table to be used on dashboard, it takes typically 200 upstream tables & views to build that one final destination table. Of course computational costs are high!
- Hidden time bombs in the form of excessive ephemerals and views. One day they just wake up to a change introduced that finally broke something downstream, because nobody looked at what they built to see that there are loops and loops of those built on top of each other.
- Redundancy happens (cue more storage costs coming): When an engineer introduce changes to the pipeline, they rarely (if ever) consider if the change introduced is necessary in the first place, or the impact, precisely because nobody pay attention to the data lineage. If they are adding a new table to answer an ad-hoc analysis question business team is chasing them for, it is not considered in the context of things that already exist (should I just add some extra columns to this data model?) — instead they create a whole new model, repeating a bunch of columns and logics that already exist elsewhere, adding some more spices and new logics of calculating the same metrics. Voila! Goodbye single source of truth.
- Accidents will happen. If your engineer drops a table from the pipeline (this happens sometimes — “I thought nobody uses it!”) — other than lacking a cup of coffee in the morning, there is a higher chance they lack the visibility of lineage to evaluate the impact of their action.
To recap: data teams will definitely experience high computational & storage costs and frequent breakage that disrupts business, if they don’t pay attention to data lineage.
Proof?
Enough with arguments and concepts. Let’s look at a real example.
At the beginning
— — there was nothing
I meant it. There was nothing. We asked the team that needed help with their broken pipeline, and the answer we got is a blank look. The team did use dbt. However, no lineage was in existence due to the way they used the tool — just purely copy pasting SQL script without referencing using {{ref}} and {{source}}.
Their whole pipeline takes 3 hours to run on a good day, with 500 models and zero tests.
On a bad day, well, that’s when we were called: the pipeline was just running forever and nobody could debug within a reasonably short time in the midst of panic. They had to stop the pipeline run and couldn’t figure out what caused the issue.
If you are unfamiliar with dbt and dbtCloud, the curly brackets are essentially a jinja syntax that helps you visually display the lineage later on, and understand the relationship between all the data models you have in your project.
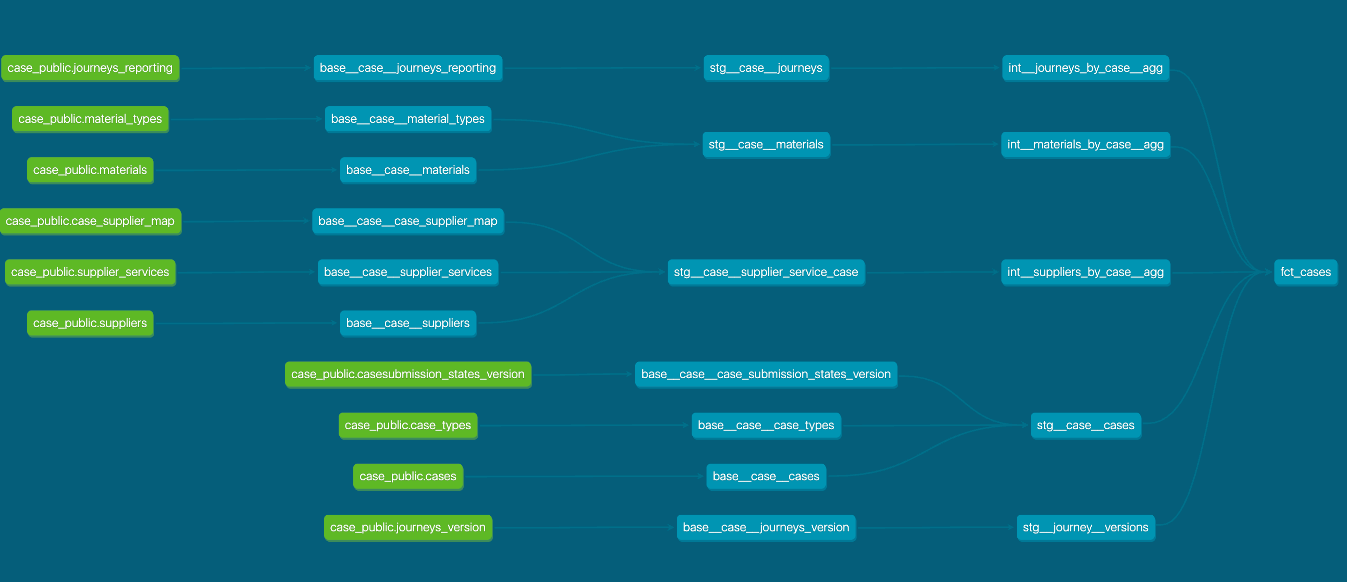
After a bit of python magic and pains, our engineer managed to convert the whole dbt project into proper syntax use, which then allowed us to see it in just a fraction of the whole — the spiderweb you saw earlier.
Now, for the purpose of our demonstration here, let’s take a look at only 1 single table that needs to be built daily and used by more than 10 dashboards in the company: case_facts — with 221 upstream models to create it. In the full pipeline, we would need to wait 1:18:00 hour for this table to be materialized.
Yes, you heard that right — 200+ models upstream. Why? That’s what happens when you don’t look at what you build.
The Fix
When we came in, the fix didn’t magically happen within a day or two. It was a tedious process. Quick fixes were applied to instantly prevent further stress and costs to the business, but the real work began after: refactoring was inevitable, questions had to be asked, business needs had to be evaluated, pushbacks needed to happen, proper process of testing and CI/CD was introduced and enforced.
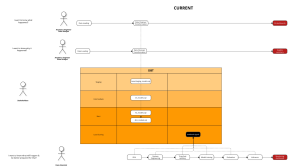
The technical side of things were always the easier part, once you have got enough information to work with. And here is what it looked like at the end:
Just straight DAGs, no webs, no entangled lineage that needs to be zoomed in and out for comprehension.
Instead of 1:18 hour to have case_facts updated, it’s now 2 minutes.
Instead of 220 models upstream, it’s now 18 models upstream.
Not to mention there is now a visibility of lineage that helps the team debug and troubleshoot problems within an hour or two, instead of days.
Now, none of these changes are possible if we hadn’t actually taken a look at the whole data lineage. None of the changes and advocacy for optimization could have happened, simply because nobody could actually describe the state of things as is, until they actually have a lineage graph in front of them.
The Impact in Numbers
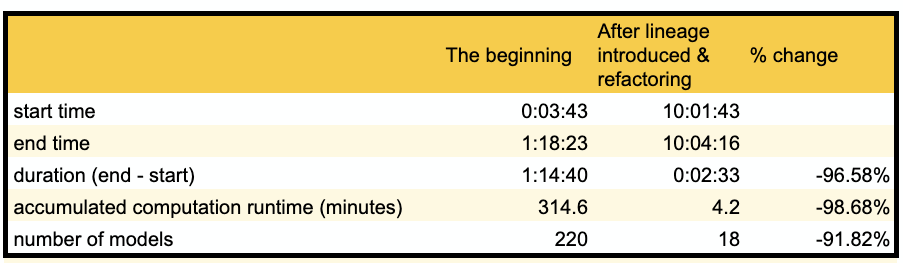
A whooping 90+% reduction in everything: runtime, number of models that data team has to maintain, and no more hidden time bombs.
In dollar terms, it would not translate directly to 90% of cost reduction in total, but you can bet if we look at computational cost alone to produce this single table, we can say with confidence it has reduced by that much.
In time value, it’s unaccountable. Engineers instead of spending hours in valley of agony, can enjoy their coffee and work on more interesting problems than fixing a broken pipeline.
As a manager, you are no longer paying your engineers to put down fire anymore, they are freed up to do analytical work that benefit the organization.
Data lineage is essential because it has prevention and maintenance benefits for your team, both in terms of dollars and invaluable time.
Where to start with data lineage?
If you are now convinced of the benefits of having data lineage accessible for your data team, the next logical step is to ask: What to do next?
First, data lineage at a surface can be provisioned with a right tool, but as with anything else, it must be accompanied with the right process and right mindset.
When we talk about tools, there are a few out there in the market and each will have its pros and cons that will either fit into your business or not. However, if your team have already developed things in dbt, it’s just logical to leverage the built-in feature of dbtCloud and focuses more on the processes and change management that need to happen to help your team take a first look at what you have built.
There are a few critical conditions to make data lineage endorsement successful:
- Data lineage must be built into the CI/CD workflow. There should be a review process that actively root out potential lineage problems with each change introduced. This will then help your team build a new habit and critically think about changes and how best to optimize things.
- Data lineage must be accessible first to the whole data team, and ideally the whole organization. There is no point to have a “local” data lineage which is only stared at by your best engineer in the team. It must be public, visible, and looked at by everyone on the team. This is where dbtCloud provides value to your team with things ready setup with a few clicks (on top of ready properly used syntax), without worrying too much about adding additional web-hosting work to make lineage visible to the organization, or additional platform costs on top of your transformation tool.
- Data lineage should be the first on your engineers’ mind when they consider a change in the pipeline. They should have the habit of asking these questions: What is already available, if I add this would it be repetitive (anti-DRY)? What can I tweak? How would this change impact the downstream usage of this dashboard?
- Embracing the best practices: There are no short amount of best practices out there to start. I would often refer to dbt for this one as it’s often the tool that covers both transformation need and provide access into data lineage. This is not by coincidence. Naturally, the questions that often arise from impact analysis, performance optimization, and tracing sources — are all occurring either before or during the stage of transforming data — the T in ELT. And dbt does a great job with setting up the best practices and guides to handle lineage properly, alongside with many other considerations that engineers should have when they transform data.
Summary
I hope that by the end of this post, you have understood the necessity of data lineage. In a nutshell, it should not be treated as an afterthought in your data platform, it must be endorsed in daily data works and supported by the right tool, process, and mindset. The cost of not paying attention to data lineage is always tangible in dollars. What is often unaccounted for though, is that it has invisible cost of time and trust that your data team loses and will definitely have hard time to regain.

- Elevating Wellness through Data-Driven Personalization: Restore Case Study - November 11, 2023
- Revolutionizing Credit Risk Management: Ameriprise Financial’s ML Leap - November 10, 2023
- Elevating Customer Engagement: VinID’s Personalization Strategy - November 9, 2023