Howdy y’all, at Joon we try to find talented individuals for all aspects of our business and try to engage as many people as possible in the ways of data awesomeness. Surprisingly, there are still quite a few people that don’t quite understand what the modern data stack is, what it means to be a company specializing in data services, and what we do in our day to day. So I set out to write this series from my many years in the industry starting with the very basic concepts, go through some history (cause I’m old) to more advanced material for not only my team but for anyone looking to get involved in the industry. My first installment is the very basics of data analytics.
I’ll try to make fresher content in the future but enjoy my first go at it.
Reporting plays a major role in the progress of a business. Reports are the backbone to the thinking process of the establishment and they are responsible, to a great extent, in evolving an efficient or inefficient work environment.
The significance of the reports includes:
- Reports present adequate information on various aspects of the business.
- All the skills and the knowledge of the professionals are communicated through reports.
- Reports help the top line in decision making.
- A rule and balanced report also helps in problem solving.
- Reports communicate the planning, policies and other matters regarding an organization to the masses.
If you have ever been part of a successful business you have probably interacted with a report in one form or another. Traditionally companies need a few key reports to operate at a fundamental level. Reports like:
Liquidity
Profit and Loss
Payroll summary
Revenue report
Reports are typically made up of different metrics. Metrics are measures of quantitative assessment commonly used for assessing, comparing, and tracking performance or production. Generally, a group of metrics will be used to build a dashboard that a management team or analysts review on a regular basis to maintain performance assessments, opinions, and business strategies. Metrics have been used in accounting, operations, and performance analysis throughout history. Metrics come in a wide range of varieties with industry standards and proprietary models often governing their use. Here are some revenue based metrics:
Revenue YTD (year to date)
Revenue MTD (month to date)
Revenue QTD (quarter to date)
Revenue YTD (year to date)
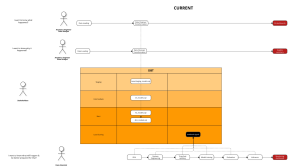
Metrics combined in a single report or a collection of reports would make up a “dashboard”. A dashboard using the above metrics would be called a “Revenue dashboard”. It would look something like this:

This is the data part
In order to define metrics and build reports you need information. In today’s world this information comes in the form of data that is created by the organization by either collecting information in the form of spreadsheets, application data, or even machine created data. Forms of data are most commonly defined as structured data, semi structured data, unstructured data, with many other denominations and definitions branching off from here.
Who uses data?
Reports were typically used in the past by executive teams and upper management. You needed a lot of practical business understanding about your department within your industry. You needed a lot of time to create the reports, about a month. And you needed to have the skillset to build a report either in an available tool like excel or something more advanced that required SQL knowledge. This process is slow, costly, inefficient, and how a lot of companies still operate today. If you ask most accountants or marketers how much time they spend building reports and trying to get information to build these reports you would see clearly how much value there is in automated reporting and data analytics. Today many companies still operate in the traditional sense of department heads and management creating reports to show their departments value to the organization as a whole. What has happened over the years? Different departments have adopted different sources of information or “truth” through the use of department specialized tools offering departmental analytics. More on this another time.
With the advent of easy to use business intelligence tools, the objective is for everyone to be able to use reports to create what we call “data democratization”. The goal of this movement is to achieve a “data driven culture” within an organization to where everyone has the ability to view data they create and own to build a report that answers their business questions. Here is a great article defining data democratization.
I hope this helped lay the foundation for your journey into the world of data analytics. If you enjoyed it and are trying to understand more about data, follow along in this series of blogs.
Have a request? Want to know more about Joon or what we do? Leave it in the comments.

- What the heck is data analytics? Explain it like I’m five. - June 8, 2022
- Best Practices for Managing Data Access to BigQuery - October 11, 2021
- How PE firms can turn data science into a competitive advantage - October 11, 2021