1. What is Data Observability?
Data observability is the ability to observe data and data-related jobs in your data system. This will help you monitor your data pipelines, understand whether the system is operational, where the data are coming from and flowing into, which transformations are fast, which jobs are resource-consuming, where the data errors are coming from, and why. An effective Data Observability tool will help the Data Team quickly troubleshoot pipelines, fix issues, implement tests, build robust data systems, and effectively manage resources.
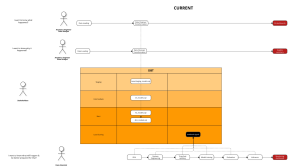
At Joon, we have serviced clients with large data warehouses, with hundreds of data assets (tables, models, dashboards…) and interlocking, complex logics, that it becomes impossible for a single person to fully understand the orchestration pipeline. Analytics engineers must divide domains and handle their respective scopes. Even then, when an issue arises or a change comes whose effects ripple from sources throughout transformation tables to end-user dashboards, it is challenging to trace the cause or assess the change impact. In moments like this, having a powerful Observability Tool can be critical in achieving timely resolution of issues or requests.
2. What is Elementary?
Elementary Data is an open-source data observability tool, which has features on data linage, anomaly detection, and pipeline performance reporting. It’s integrated into the dbt workflow as a package, along with Slack for messaging & alerts, and Github Actions for automated command run / CI CD. For those who are already using dbt as part of their transformation & orchestration pipeline, this is a convenient yet powerful addition to their setup.
Let’s see in more details what Elementary can do:
(1) Data Observability Report, which included Test Results & Data Linage:
Similar to the dbt docs generevate & serve, which can generate a documentation site for your project, Elementary can also generate a site that documents your data pipeline with a complementary view on testing.
There are 3 tabs:
- Lineage: graphical view where you can view the relationships between models – the downstream, the upstream, sources, exposures. But you can also view the tests which have run for each table – how many passed & failed. Clicking on the model will show all the model’s tests details – test name, test type, column name, ran time, exact query, output… You can also filter the graph by model’s name, test’s name, test type, test result.
- Test Results: list of all tests in the pipelines from the latest run, with test details, upstream & downstream view, and filter capability
- Test Run: list of all tests in the pipelines from ALL RECORDED RUN. This will show each test’s historical run fails or passes, when the fails / passes happen, and the overall fail rate
Essentially, this report is geared towards debugging the pipeline: when there’s a model error, you quickly check if the upstream models also have the errors, and which downstream models were impacted. If you have implemented enough robust tests throughout the pipeline, issue source can be quickly identified and addressed with this report.
This report can be shared through Slack, or hosted on AWS / GCS.
(2) Anomaly Detection:
For usual model testing, we can rely upon dbt’s native tests, expand into dbt-utils‘ and dbt-expectations‘ pre-written tests, or write your own tests to enforce certain unique logics. Elementary goes a step further with anomaly detection, which collect metrics and metadata over time, then on each execution, analyze the new data, compare it to historical metrics, and alert on anomalies and outliers. Elementary define outlier by seeing how many standard deviations it is from the center, or called the Z-score approach, and it can exercise this over table row count, freshness, column null percentage, min-max value… This is a robust approach to detecting problems in your pipeline, while also simple to set-up. The configuration is similar to how normal dbt tests’ config are, in project & models’ .yml file.

(3) Pipeline Performance Reporting:
dbt artifacts store each project’s metadata and logs about resources, runs, and execution. Elementary can load these data into tables in your database at the end of each run, then they can be queried to understand the current pipeline’s performance: which model takes the longest to run, or run longer than 30 mins, when did that happen… Also, other metadata on models, sources, tests… can also be loaded and used. These tables can be configured to be created in specific schemas, disabled or enabled, or even include new fields from other dbt artifacts as well. The metadata will then be available for analysis, visualization, monitoring or alerts.

3. Assessments:
The Good:
- Well-integrated into the dbt workflow. For those familiar with dbt, this is just another package, with minor additional configuration on profiling and where to write dbt artifact data. The other processes are complementary to dbt’s existing flow, minimizing the Engineer’s efforts:
- Anomaly tests are defined in the .yml files like normal dbt tests for models / sources…
- Project metadata are automatically inserted / updated each run, and can be configured in the dbt_project.yml file like normal dbt models.
- In cases of robust testing already implemented, Elementary’s Observability Report can be very helpful at locating and debugging problems. The report’s unique strength is in organizing the tests’ results, and graphing them out to Engineers, so the Engineers can trace the problem to where it started, or see where it could potentially cascade into.
- The pipeline’s metadata exposure is great for data monitor, audit, and improvement.
The Room-for-Improvements:
- Elementary’s Observability Report provide Data Linage at table’s level, not columnar’s level. As such, when tests are not already implemented extensively, or if data errors are not caught by existing tests, then problem tracing will be the same as reading dbt’s documentation linage graph.
- In this use case, other columnar Data Linage solutions might be better, though none seems as seamlessly integrated into dbt as Elementary, and many with cost consideration in mind:

- Common pitfalls in ML projects and how to avoid them. - January 5, 2024
- Data Observability with Elementary - November 5, 2022
- Data Deduplication with ML - November 2, 2022