Things you need to be aware
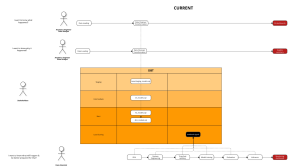
Workflow
Tableau uses structured and unstructured data to create visualizations and has the added features of storyboarding and Spatial File Connector. Looker creates customized visuals and also allows you to choose from a library full of blocks with pre-made dashboard and visualization templates.
Being one of the first and most popular BI tools in the planet, Tableau is a powerful software for data visualization and presentation. Tableau suite consists of different type of products, with different purposes.

Analysts can build dashboards locally by the software version, then publish them to the cloud ones and share them with others. With Tableau, analysts can also include other languages, such as python and R, which makes the tools usable to a different type of users.
On the other hand, Looker is user-friendly and completely cloud-based. That means all users including Looker Engineers, Analyst, and End users can collaborate and work in a single platform, without constantly publishing from local environments like Tableau. The application of version control also separates the development and production environment, which makes sure end users can see final results while developers can comfortably test and implement new requests without creating unnecessary downtime.
Before migration, you need to clearly explain the differences in BI tools’ workflow and practice to end users. It can be unfamiliar when first time using Looker, so make sure people be aware and learn how to adapt to the changes.
How do these tools connect to the database?
Tableau connects and extracts the data stored in various places. It can pull data from any platform imaginable. A simple database such as an excel, pdf, to a complex database like Oracle, a database in the cloud such as Amazon webs services, Microsoft Azure SQL database, Google Cloud SQL, and various other data sources can be extracted by Tableau.
Tableau allows connection from various data sources, including servers and web connectors. There 2 type of connection: Data Extracts and Live Connections. Tableau Data Extracts creates snapshots of data and loads into system memory to be quickly recalled for visualization, while Live Connection queries data directly from your data source. Dashboards that require complex calculations and large datasets usually go with Data Extract, which means data need to be refreshed from the original data source regularly to updating purposes.
Looker doesn’t import or create any snapshots on data. It queries data directly from a data source using SQL code, and visualizes them to dashboards and lookers. The tool is similar a front-end framework that allows you to talk to your data warehouse/database and its code modeling layer allows you to move between dialects if you ever have to do that.
Migration plan
Here in Joon, we have 2 powerful tools – Looker and Dbt. Each one has its own advantages and disadvantages. Dbt is born for complicated logic consisting of different schema and dimensions, while Looker is suitable for dynamic and flexible fields/metrics.
In the case of migration, since Tableau is not allow similar flexible level as Looker, there is usually complex and counter-intuitive metrics listed there. Separating dimensions, logic to migrate to dbt and dynamic measures coded in Looker should be the first tasks.
Understand Tableau measure
As mentioned above, due to complexity, you may need to spend a few hours, even a few days to understand them in Tableau before moving to the next step. Below picture is a typical example of how measures are written in Tableau:

Logic documentation
To document the measures, I suggest thinking about the following criteria.
With dbt:
- Does the logic require multiple dimensions or just one?
- Do we need to create more tables in dbt to accommodate the logic, or utilize the existing ones?
- Do we know business users/ previous teams who are owners of the logic to get a bit more context?
With Looker:
- Does the logic require dimensions from the different table?
- Can we use “filter” list in measure to filter schema value created from dbt, to make the logic more dynamic (e.g: one logic can apply to revenue, cost, and total customers).
I also follow the below steps in documenting:
- List down all currently-used metrics, and new dimensions to add to existing tables in dbt
- Metrics list:
- metric a
- metric b
- metric c
- Custom dimensions :
- dimension a
- dimension b
- dimension c
- Metrics list:
- Separate Looker-dbt metrics.
- Customize metrics to dbt coding style.
- Customize metrics to Looker coding style.
- Try to only involve 1-2 dimensions in the “filter” list.
- For complicated metrics, and tables you should cross-check to the client’s users, to make sure you understand them correctly. This is also advisable to logic that causes duplication in dbt models.
| Measure | Formula |
|---|---|
| Looker Metric 1 | measure: total_revenue_active_customers { type: sum sql: ${revenue} filter: [ is_active_customers: “yes” ] } |
| Looker Metric 2 | measure: total_orders_subscription { type: countdistinct sql: ${order_id} filter: [ is_active_subscriptions: “yes” ] } |
| Looker Metric 3 | measure: total_customer_after_restructure { type: countdistinct sql: ${customers} filter: [ is_after_restructure: “yes” ] } |
Dbt models
- If it is necessary, you need to create new tables/ directories for new models migrated from Tableau. Try to follow dbt best practices, especially when Tableau custom tables are using traditional practices (built from raw tables with long and complex lines of code).
- In the example below, by applying “for” loops in dbt, we can cut the number of coding lines from 200 to 100.


- After creating the required tables, it’s time to migrate the logic. If the logic is relatively short, we can involve them directly in dbt models. Otherwise, it is necessary to create a macro file to store complex logics, to cope with any changes in the future
Looker models and dashboard building
- You try to keep LookML code clean, and short and rely on logic you build in dbt (think about all the hard work you put in turning those counter-intuitive logics into readable SQL).

- After gathering the required measures, building a dashboard should be quick and intuitive.
Audit and reconciliation with Tableau
Finally, after finishing the dashboard, it is super important to compare and reconcile your dashboard in Looker and the original one in Tableau.
You can compare the charts if it’s simple. Otherwise, we can use the following code to check discrepancies between your models in Dbt and customer tables in Tableu, or You can copy the auto-generated code in Looker and copy it to Dbt for testing:
{% macro test_relations() -%}
{% set prod_etl_relation=adapter.get_relation(
database=target.database,
schema=target.schema,
identifier='fct_orders'
) -%}
{# schema='analytics', #}
{% set dev_etl_relation=adapter.get_relation(
database=target.database,
schema=target.schema,
identifier='fct_orders2'
) -%}
{% set audit_query = audit_helper.compare_relations(
a_relation=prod_etl_relation,
b_relation=dev_etl_relation
)
%}
{# ,primary_key='dim_businesses' #}
{% set audit_results = run_query(audit_query) %}
{% if execute %}
{% do print(audit_query) %}
{% do audit_results.print_table() %}
{% endif %}
{%- endmacro %} Reference
- Looker vs Tableau – How to Pick Which is Right for Your Business
- What is Tableau? Uses of Tableau Software Tool
WANT MORE
Download our whitepaper or Subscribe to get our latest updates


- Azure data service platforms overview - November 5, 2022
- How to migrate dashboards from Tableau to dbt and Looker - September 7, 2022