Written by Satish Chilakala
The best customers are not always what we call the high-value customers

With some free time at hand in the midst of COVID-19 pandemic, I decided to do pro bono consulting work. I was helping a few e-commerce companies with analyzing their customer data. A common theme I encountered during this work was that the companies were more interested in getting a list of their best customers so they could run some marketing campaign to boost their revenue. My recommendation has always been that every customer segment has some valuable insight to offer and that best customers depend on the immediate company goal/objective at hand. In other words, best customers are not always what we call the high-value customers. In this article, I will highlight various insights RFM segmentation can provide.
Segmentation using RFM Analysis
Analysis based on RFM — stands for Recency, Frequency and Monetary — is probably one of the easiest ways to segment the customers given companies usually have the customer purchase information readily available to them.
Here is a sample customer purchase history data that is needed for the RFM analysis. With this, each customer is scored on the RFM attributes on a scale of 1–5 (or 1–4 or 1–3, depending on how granular you want to look at the purchase behavior) with 1 being the least and 5 being the best score.
For example, a customer with a most recent purchase will have a score of 5 on Recency, whereas a customer who hasn’t purchased in a while will have a score of 1.
Here the important thing to note is that the criteria for scoring varies business by business and by understanding customer purchase cycles, we can come up with the scoring criteria. For this sample data, I used the following recency scoring based on 2-month purchase periods. Once you score on all three attributes, we can create RFM score (sum of these three scores) and RFM Category (when R=4, F=3, M=4, RFM Category = 434). You might have seen cases where RFM score was used to segment customers. This method has some serious pitfalls and its better to use the RFM category instead.
Using a 5 point scale could lead up to 125 RFM categories. Next step is to group these RFM categories into various segments. While the standard RFM analysis doesn’t take into account other data points such as length of the relationship of a customer, but this is the time to look at the purchase data holistically and assign segments to the RFM categories. For example, a customer with long relationship with the business, most recent purchases but low monetary might have used promotional offers more frequently than a customer with similar recency, monetary but less frequent and shorter relationship with us. One could be segmented into Deal Seeker and the other one could be segmented into Newcomers.

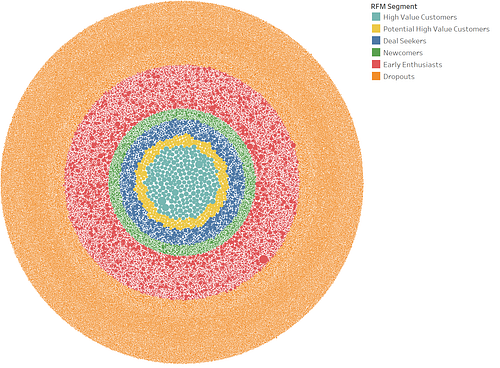
In the above example, I have identified 6 segments with uniquely distinguishable purchase behaviors.
Dropouts: In other words these are the lost customers. They became our customers through initial promotional offer and either didn’t come back or made 1–2 subsequent purchases.
Early Enthusiasts: These customers were with the company for a relatively longer period of time than Dropouts and made frequent purchases and spent lot of money. However, they were lost along the way. These will be the best customers if the objective is to reactivate the lost customers.
Newcomers: As the name suggests, this segment consists of customers who are relatively new and active. Any marketing efforts for this segment could be to promote them to loyalty programs or offer promotions to try other products.
Deal Seekers: These customers have relatively long relationship with the company and are currently active. They are interested in making frequent purchases but usually on look out for promotional offers. These will be the best customers if running a campaign to boost sales.
Potential High Value Customers: These are relatively newer customers compared to Deal Seekers but are less sensitive to the price or are less keen on promotional offers. In shorter period of time, they made frequent purchases and spent lot of money with the company. Nudge them towards High Value Customers and sign them up for loyalty program.
High-Value Customers: These are the most loyal customers. They are active with frequent purchases and high monetary value. They could be the brand evangelists and should focus on serving them well. They could be the best customers to get feedback on any new product launches or be the early adopters or promoters.
Getting Insights from Visualization
Once the customer segments have been identified using RFM analysis, it is always a good idea to visualize these segments not only for a sanity check but also to derive actionable insights. I used Tableau to visualize the segments.

Recency and Frequency score matrix chart is usually a good one for sanity check. As R score and F score increase, the monetary value increases. Higher R score may not necessarily lead to higher monetary value given that the business may have acquired new customers recently.

The treemap shows how each customer segment is contributing to the total revenue and how much each customer within a given segment is contributing to the total revenue. In a way, this helps predict how consistent revenues will be given how many customers have churned and how active other segments are.
When there is geographic information for the customers, plotting them on a map will give some unique insights. One of the interesting cases I have seen is for an e-commerce company with some retail presence. Mapping the customer geographic data helped explain clusters of online shoppers around geographies where the company has retail store presence. Interestingly enough, these clusters of online customers were acquired organically. Accordingly, you can evaluate strategies to expand retail presence that could potentially boost e-commerce business.

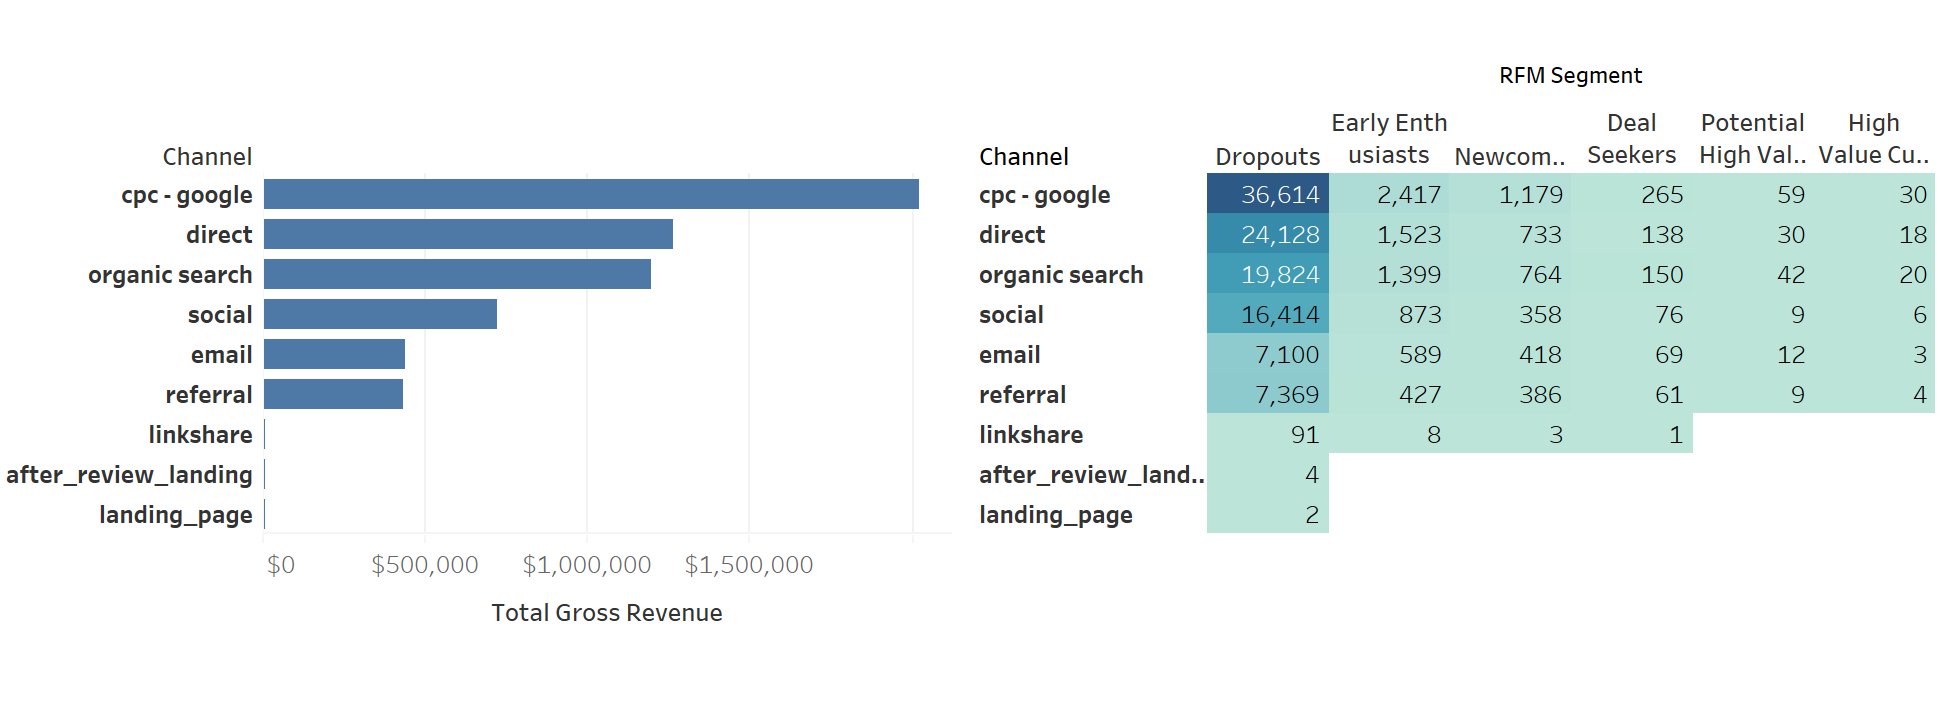
Another thing is the channel performance. Customer segmentation helps with understanding channel performance better. By looking at customer lifetime value (LTV) per segment and what portion of each segment is attributable to a channel, acquisition cost associated with that channel, we can evaluate channel performance more accurately than without segmentation.
In Conclusion
Usually, startups tend to be growth focused rather than retention focused. Even though they are resource constrained, startups are better off investing some of their limited resources on understanding their existing customers so they can device effective retention strategies that could, in turn, help them with acquiring new customers. After all, it may end up being much cheaper to retain your existing customer than to acquire a new one. Word of mouth is still a major customer acquisition channel and you want your customers to be the evangelists for your product.
Reiterating the quest for the best customers, it may seem obvious that high-value customers are the best customers. When there is a goal at hand — say to run a marketing campaign to boost revenue — we should dig a little deeper to find out who the best customer would be for that specific goal or which customer segment is at the bullseye.
How JOON help your data visualization
RFM analysis is particularly useful for sales and customer teams needing to focus their limited time and money on those customers for whom a change in behavior. But not every enterprise has an effective data strategy. At Joon Solutions, we support data-driven decision-making—better, faster, and cheaper with a team of data scientists and cutting-edge technology. Companies need insights from data to make smart business decisions and compete in modern business now more than ever before.


- What the heck is data analytics? Explain it like I’m five. - June 8, 2022
- Best Practices for Managing Data Access to BigQuery - October 11, 2021
- How PE firms can turn data science into a competitive advantage - October 11, 2021