Exploratory Data Analysis (EDA) is something that we do pretty frequently. This is the first and foremost step to do at the beginning of any project, before we jump into more sophisticated work like refactoring or modeling.
It’s like saying “Hi” to your lovely dataset so that we can gain confidence in every extracted information we get from the data later on.
Follow me step by step on how to perform EDA easily with the help of Datagrip and SQL.
Note: In this article, I use Snowflake public dataset and Snowflake SQL commands for all SQL queries. They’re all basic SQL syntax, so if you’re using a different version of the SQL language (MySQL, SQL server, BigQuery, etc.), there would be little or no syntax conversion needed.
1. Dataset Overview
First of all, we need an overview of the dataset that we’re about to work with: a list of tables and views, as well as their columns names.
In DataGrip, you just need to click the small box next to the data source name, choose the schemas that you want to explore, then click refresh. One more click of the chosen table to see the list of its columns names
Now all the dishes are on the table, let’s enjoy our data meals.
2. View data
Now you want to know what the actual data in each table looks like. Is it good-looking or very ugly? 😐
Simply double-click a table in the Database Explorer in Data Grip, the table opens in the data editor.
Bonus tip: “Ctrl+B” is the shortcut that gives you the DDL of the table. It’s very handy when you want to quickly check the datatype of all the columns, or copy the list of columns’ names. I personally often use this instead of typing SQL syntax: describe table X
Pretty simple to this point, right? EDA and DataGrip is not such a hard thing huh 😀
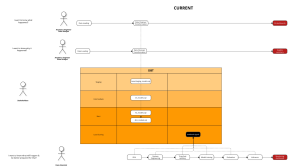
3. Relational Diagram
Next, you want to know how each of the tables in the dataset is connected to each other. In other words, you need to know which is the primary key, which is the foreign key, and how tables are connected via these keys.
DataGrip has a great function for us to look at the overall relationships among all the tables.
Right-click a database object and select Diagrams | Show Visualization (Ctrl+Alt+Shift+U), and magical things happen, tarraaa!
Note: You can click the comment button to make the column comments visible in our diagram.
You can add custom notes to the diagram later when you found some interesting about our data guy. For example, I found that there’s a column contains both null and 0 values, indicating it needs a cleanup at later stage.
Tips: If you want to explore data from this diagram, simply click the table, then press F4 to see detailed data.
After finishing with our relational diagram, you have several options to save it:
- Copy to Clipboard
- Export to Image File
- Save UML Diagram
Note: This UML format is an internal format supported only by DataGrip. So don’t waste your time trying to open & edit it by UML editing software like: StarUML, Lucidchart, Drawio,…
4. Relationship types
Now we know table A is connected to table B by column X. However, which kind of relationship is this? Is one X record in table A mapped with one or many record(s) in table B and vice versa? There’s a fancy term for this: cardinality.
4.1 Approach 1
If your dataset have columns constrains well-defined, Datagrip can auto-detect the relationship between the 2 columns you specified in the SQL scripts.
In the above example, symbol 1..n ↔︎ 1: is understood as:
- one
CA_ADDRESS_SKin Address table can be mapped with one or moreC_CURRENT_ADDR_SKin Customer table - one
C_CURRENT_ADDR_SKin Customer table can be mapped with only oneCA_ADDRESS_SKin Address table
4.2 Approach 2
If you don’t see the cardinality auto-filled in Datagrip, you could manually determine the relationship between 2 tables by following these steps:
- First of all, determine the PK (primary key) of each table
- Customer table: PK =
C_CUSTOMER_SK - Address table: PK =
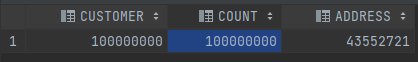
CA_ADDRESS_SK - Then, we use SQL to determine the cardinality:

- Lastly, we interpret the result using the below logic:
count = table_pk > 0: one record in other table could be mapped with one or more record in this tablecount > table_pk > 0: one record in other table could be mapped with only one record in this table
Relationship between Customer-Address tables via address_id is many-to-one. Wonder why it is so? That’s your homework for you after reading this blog 🙂
5. Dirty data
Much often we would encounter some columns containing not-really-clean data. Either ID columns have some abnormal records, or some null values represent themselves as blank, “Null”, “None”, “N/A”.
To quickly spot these cases, we could try the following SQL scripts:
- For string columns:

- For numeric columns:

6. Search options
Let say you want to know the total current inventory for all economy-sized items, and you don’t know which table & which column stores data on items size. Instead of having to look at each table and each column in the datasets, straining your eyes with hundreds of data on the screen, you can utilize Datagrip search options.
6.1 Item search
You guess the column containing item size would be named something with “size”.
In this case, from the main menu, select Navigate | Search Everywhere or press Shift twice to open the search window, then type “size” to find any table/ column which names contain “size”
6.2 Full-text search
From your business knowledge, you know the column you are looking for would contain words like “economy”, “small” or “large”.
In this case, select objects in which you want to perform your search. You can select a database or a group of databases, a scheme or schemes, or even separate tables. Then right-click the selection and select Full-text search (shortcut is Ctrl+Alt+Shift+F). In the search field, type your search request and click Search.
Note: Be well aware that this type of search requires more computation work than the previous one, as it has to run a query against all columns in the objects you chose. Therefore, you should only use this one in case item search option doesn’t work for you.
7. Compare data
Sometimes we would want to look at 2 tables at the same time to get some useful insights.
To do that, we just need to select 2 tables that we want to compare, then right-click the selection and navigate to Compare Content.
8. Other Resources
Based on your need, you may also want to know:
Also, don’t forget to check out the official docs of Snowflake SQL and DataGrip to update yourself with many more cool things that altogether they could provide:

- Common pitfalls in ML projects and how to avoid them. - January 5, 2024
- Data Observability with Elementary - November 5, 2022
- Data Deduplication with ML - November 2, 2022